I want to create a visualization over a data table. How do I do that?
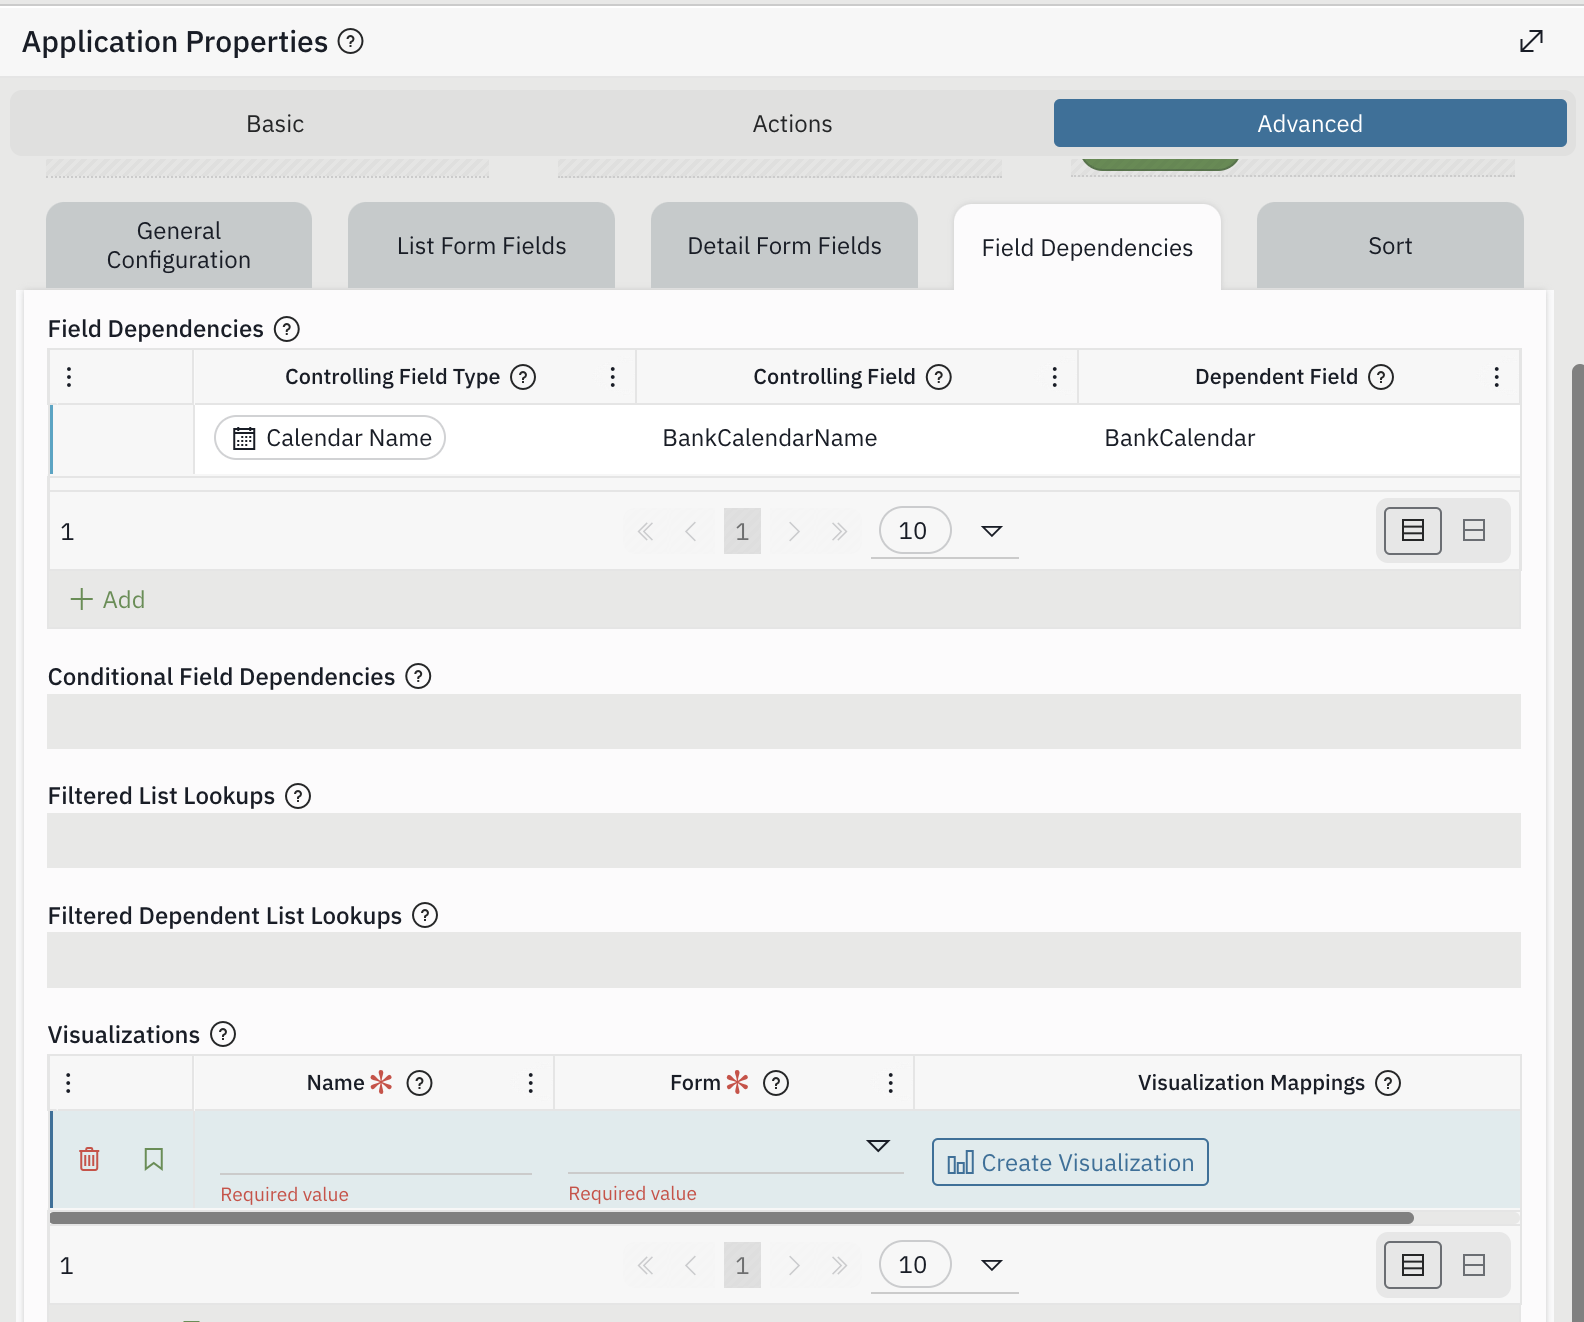
In application Builder, navigate to the ‘Field Dependencies’ page. If you scroll half way down the page there is a section for Visualizations. Provide a name and the form type of list then click the visualization builder. This will open the visualization builder to select your data and type of visualization you are looking for.
Is there a way to visualize data without needing to build or modify an application?
You can use Interactive Reports